Tags
Tab Item Content
Join Us!
Archives Meta
Americans of Europe...
 
Notifications
Clear all

Americans of European ancestry are only 41% of the U.S. population

6 Posts
3 Users
0 Likes
1,236 Views
josh avatar
Posts: 4380
Registered
Topic starter
(@zexsypmp23)
Member
Joined: 5 years ago

Regions and Countries of Origin

In 2016, Eastern European immigrants accounted for the largest share of all Europeans in the United States, at 44 percent (see Table 1). Northern and Western Europeans made up about 20 percent each. The top five origin countries were the United Kingdom, Germany, Poland, Russia, and Ukraine.

Table 1. European Immigrants by Region and Top Countries of Origin, 2016

Source: Migration Policy Institute (MPI) tabulation of data from the U.S. Census Bureau 2016 ACS.

Between 1990 and 2010, the number of Eastern European immigrants increased significantly due to the dissolution of Czechoslovakia, the Soviet Union, and Yugoslavia (see Figure 2). Over the same period, the population of Europeans from other parts of the continent continued to decrease.

Figure 2. European Immigrants in the United States, by Region of Birth, 1960–2016

Note: The increase in Eastern European immigration from 1990 to 2010 is particularly noteworthy, given that after the collapse of the Soviet Union, the U.S. Census Bureau reclassified some former Soviet Republics such as Armenia and Kazakhstan as part of Asia rather than Eastern Europe.
Source: Data from U.S. Census Bureau 2010 and 2016 American Community Surveys (ACS), and Campbell J. Gibson and Kay Jung, “Historical Census Statistics on the Foreign-born Population of the United States: 1850-2000” (Working Paper no. 81, U.S. Census Bureau, Washington, DC, February 2006), available online.

Click here for an interactive chart showing changes in the number of immigrants from Europe in the United States over time. Select individual European countries from the dropdown menu.

Distribution by State and Key Cities

In the 2012–16 period, 45 percent of immigrants from Europe lived in one of four states: New York (15 percent), California (14 percent), and Florida and Illinois (8 percent each). The top four counties by European population were Cook County in Illinois, Kings County in New York, Los Angeles County in California, and Queens County in New York. Together, these counties accounted for about 15 percent of Europeans in the United States.

Figure 3. Top States of Residence for Europeans in the United States, 2012–16

Note: Pooled 2012–16 ACS data were used to get statistically valid estimates at the state level for smaller-population geographies. Not shown are the populations in Alaska and Hawaii, which are small in size; for details, visit the MPI Data Hub to view an interactive map showing geographic distribution of immigrants by state and county, available online.
Source: MPI tabulation of data from U.S. Census Bureau pooled 2012–16 ACS.

As of 2012–16, the U.S. cities with the largest number of Europeans were the greater New York, Chicago, and Los Angeles metropolitan areas, which together accounted for about 31 percent of Europeans in the United States (see Figure 4).

Figure 4. Top Metropolitan Areas of Residence for Europeans in the United States, 2012–16

Note: Pooled 2012–16 ACS data were used to get statistically valid estimates at the metropolitan statistical-area level for smaller-population geographies. Not shown are the populations in Alaska and Hawaii, which are small in size.
Source: MPI tabulation of data from U.S. Census Bureau pooled 2012–16 ACS.

Table 2. Top Concentrations of Europeans by Metropolitan Area, 2012–16

Source: MPI tabulation of data from the U.S. Census Bureau pooled 2012–16 ACS.

Click here for an interactive map that highlights the metropolitan areas with the highest concentrations of immigrants from individual countries and regions.

https://www.migrationpolicy.org/article/european-immigrants-united-states-2016#Diaspora

Reply
5 Replies
josh avatar
Posts: 4380
Registered
Topic starter
(@zexsypmp23)
Member
Joined: 5 years ago

middle eastern whites & Latino whites are excluded from the data. 

@kbella what do you think about this? my white friends are very concerned about these numbers. 

Reply
1 Reply
dyno avatar
(@dyno)
Joined: 3 years ago

Noble Member
Posts: 1462

@zexsy 

US is %60 white

Reply
dyno avatar
Posts: 1462
(@dyno)
Noble Member
Joined: 3 years ago

White Americans are Americans who identify as and are perceived to be white people. This group constitutes majority of the people in the United States: as of 2019: it numbers about 236,475,401, or 72.0% of the population. Non-Latino whites totaled roughly 191,697,647, or 57.8% in the 2020 Census. White Latino Americans totaled about 38,277,289, or 11.8% of the population in 2019. Europea…

 
Reply
Bacano G
Posts: 1272
(@jose)
Noble Member
Joined: 4 years ago

 America is still 60% European white with another 10% Latino white. 

image
Reply
Bacano G
Posts: 1272
(@jose)
Noble Member
Joined: 4 years ago

Hispanic or Latino Population


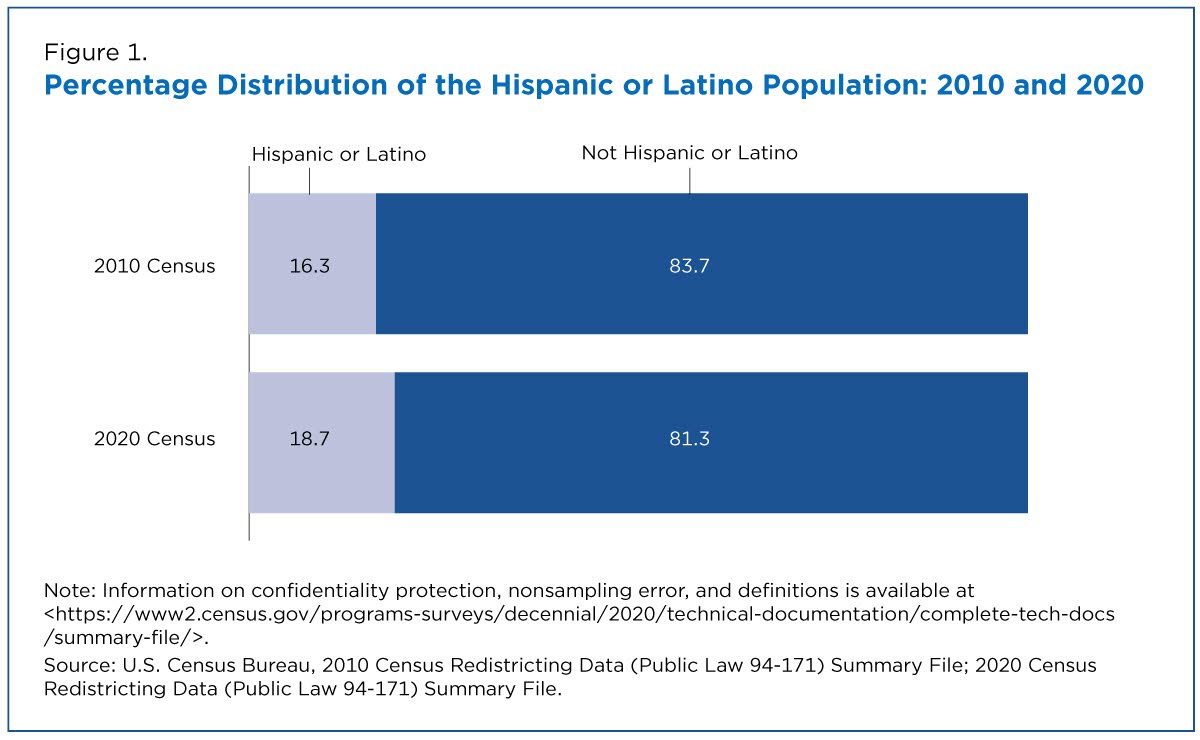
The Hispanic or Latino population grew from 50.5 million (16.3% of the U.S. population) in 2010 to 62.1 million (18.7%) in 2020.

  • Between 2010 and 2020, the Hispanic or Latino population grew by 23%.
  • Slightly more than half (51.1%) of the total U.S. population growth between 2010 and 2020 came from growth in the Hispanic or Latino population.


White Population


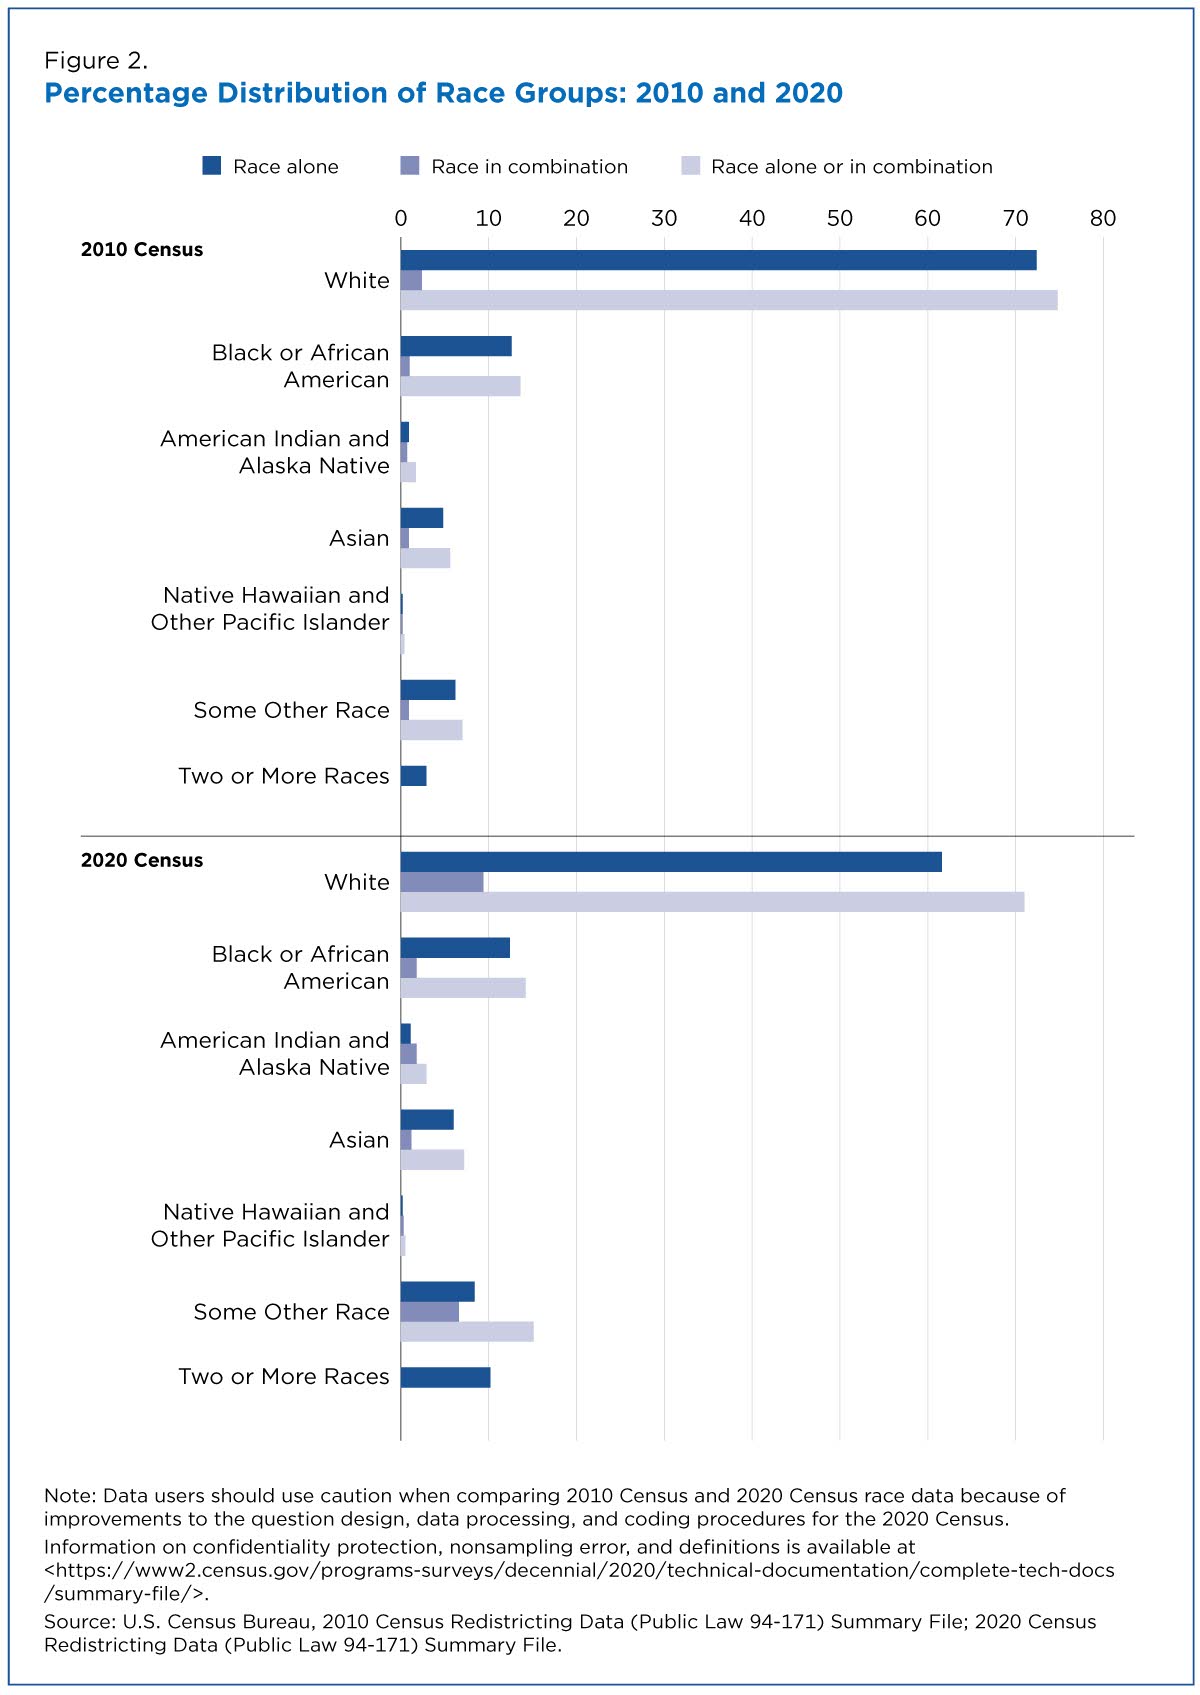
Overall, 235.4 million people reported White alone or in combination with another group.

  • The White alone population accounted for 204.3 million people and 61.6% of all people living in the United States, compared with 223.6 million and 72.4% in 2010.
  • Together with the 31.1 million people who identified as White in combination with another race group, such as Black or African American or Asian, the White alone or in combination population comprised 235.4 million people and 71% of the total population.
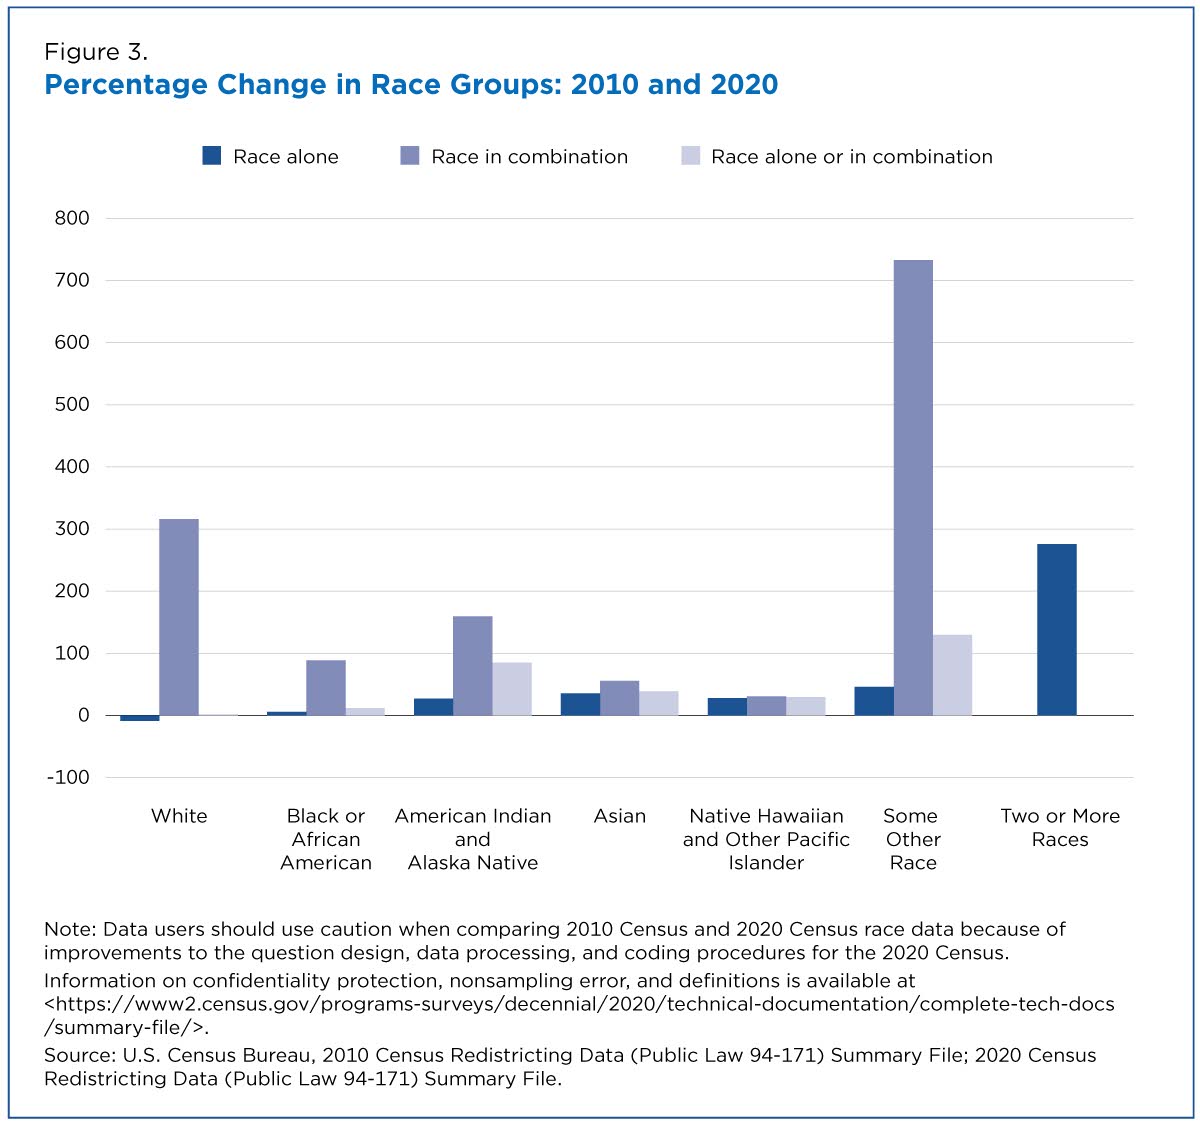
  • Although the White alone population decreased by 8.6% since 2010, the White in combination population saw a 316% increase during the same period.

The observed changes in the White population could be attributed to a number of factors, including demographic change since 2010. But we expect they were largely due to the improvements to the design of the two separate questions for race and ethnicity, data processing and coding, which enabled a more thorough and accurate depiction of how people prefer to self-identify.


Black or African American Population


The Black or African American in combination population grew by 88.7% since 2010.

  • In 2020, the Black or African American alone population (41.1 million) accounted for 12.4% of all people living in the United States, compared with 38.9 million and 12.6% in 2010.
  • Coupled with the 5.8 million respondents who identified as Black or African American in combination with another race group, such as White or American Indian and Alaska Native, the Black or African American alone or in combination population totaled 46.9 million people (14.2% of the total population) in 2020.
  • While the Black or African American alone population grew 5.6% since 2010, the Black or African American in combination population grew 88.7%.


American Indian and Alaska Native Population


From 2010 to 2020, the American Indian and Alaska Native in combination population increased by 160%.

  • In 2020, the American Indian and Alaska Native alone population (3.7 million) accounted for 1.1% of all people living in the United States, compared with 0.9% (2.9 million) in 2010.
  • An additional 5.9 million people identified as American Indian and Alaska Native and another race group in 2020, such as White or Black or African American. Together, the American Indian and Alaska Native alone or in combination population comprised 9.7 million people (2.9% of the total population) in 2020, up from 5.2 million (1.7%) in 2010.
  • The American Indian and Alaska Native alone population grew by 27.1%, and the American Indian and Alaska Native in combination population grew by 160% since 2010.


Asian Population


Approximately 19.9 million people (6% of all respondents) identified as Asian alone in 2020, up from 14.7 million people (4.8%) in 2010.

  • Coupled with the 4.1 million respondents who identified as Asian in combination with another race group, such as White or Native Hawaiian and Other Pacific Islander, the Asian alone or in combination population comprised 24 million people (7.2% of the total population).
  • The Asian alone population grew by 35.5% between 2010 and 2020. In comparison, the Asian in combination population grew by 55.5%.


Native Hawaiian and Other Pacific Islander Population


Over half of Native Hawaiians and Other Pacific Islanders identified with more than one race.

  • In the 2020 Census, 689,966 people (0.2%) identified as Native Hawaiian and Other Pacific Islander alone, up from 540,013 people (0.2%) in 2010.
  • Coupled with the 896,497 people who identified as Native Hawaiian and Other Pacific Islander in combination with another race group (such as Asian or White), the Native Hawaiian and Other Pacific Islander alone or in combination population totaled about 1.6 million people and 0.5% of the total population.
  • The Native Hawaiian and Other Pacific Islander alone population grew by 27.8% between 2010 and 2020. In comparison, the Native Hawaiian and Other Pacific Islander in combination population grew faster — 30.8% since 2010.


Some Other Race Population


The Some Other Race population was the second-largest alone or in combination race group, comprising 15.1% of the total population.

  • About 27.9 million people (8.4% of all respondents) identified as Some Other Race alone in 2020, up from 19.1 million people (6.2%) in 2010.
  • Coupled with the 22 million respondents who identified as Some Other Race in combination with another race group (such as White or Black or African American), the Some Other Race alone or in combination population comprised 49.9 million people.
  • The Some Other Race alone population changed 46.1% and the Some Other Race in combination population changed 733% since 2010.
  • Approximately 45.3 million people of Hispanic or Latino origin were classified as Some Other Race either alone or in combination, compared with only 4.6 million people who were not of Hispanic or Latino origin. Nearly all of those who were classified as Some Other Race alone were of Hispanic or Latino origin (26.2 million out of 27.9 million, or 93.9%).

The observed changes in the Some Other Race population could be attributed to a number of factors, including demographic change since 2010. But we expect they were largely due to the improvements to the design of the two separate questions for race and ethnicity, data processing and coding, which enabled a more thorough and accurate depiction of how people prefer to self-identify.


Multiracial Population


In 2020, the percentage of people who reported multiple races changed more than all of the race alone groups, increasing from 2.9% of the population (9 million people) in 2010 to 10.2% of the population (33.8 million people) in 2020.

  • The largest Multiracial combinations in 2020 were White and Some Other Race (19.3 million), White and American Indian and Alaska Native (4 million), White and Black or African American (3.1 million), White and Asian (2.7 million), and Black or African American and Some Other Race (1 million).
  • Between 2010 and 2020, the White and Some Other Race population added 17.6 million people to the Multiracial population, a change of over 1,000%.
  • The White and American Indian and Alaska Native population also increased, growing by about 2.5 million people or 177%.
  • The White and Black or African American population increased by 1.2 million people, a 67.4% change.
  • The White and Asian population increased by 1.1 million people, a 65.8% change in size.
  • The Black or African American and Some Other Race population increased by 722,383 people, a 230% change.

The observed changes in the Multiracial population could be attributed to a number of factors, including demographic change since 2010. But we expect they were largely due to the improvements to the design of the two separate questions for race and ethnicity, data processing, and coding, which enabled a more thorough and accurate depiction of how people prefer to self-identify.


Hispanic or Latino Origin by Race


Another way to examine data on race and ethnicity is to cross-tabulate Hispanic or Latino origin by race. As we saw with the 2010 Census, many Hispanic or Latino respondents answered the separate question on race by reporting their race as “Mexican,” “Hispanic,” “Latin American,” “Puerto Rican,” etc.

These and other responses to the race question that reflect a Hispanic or Latino origin were classified in the Some Other Race category, as people of Hispanic or Latino origin may be of any race per the 1997 OMB standards.

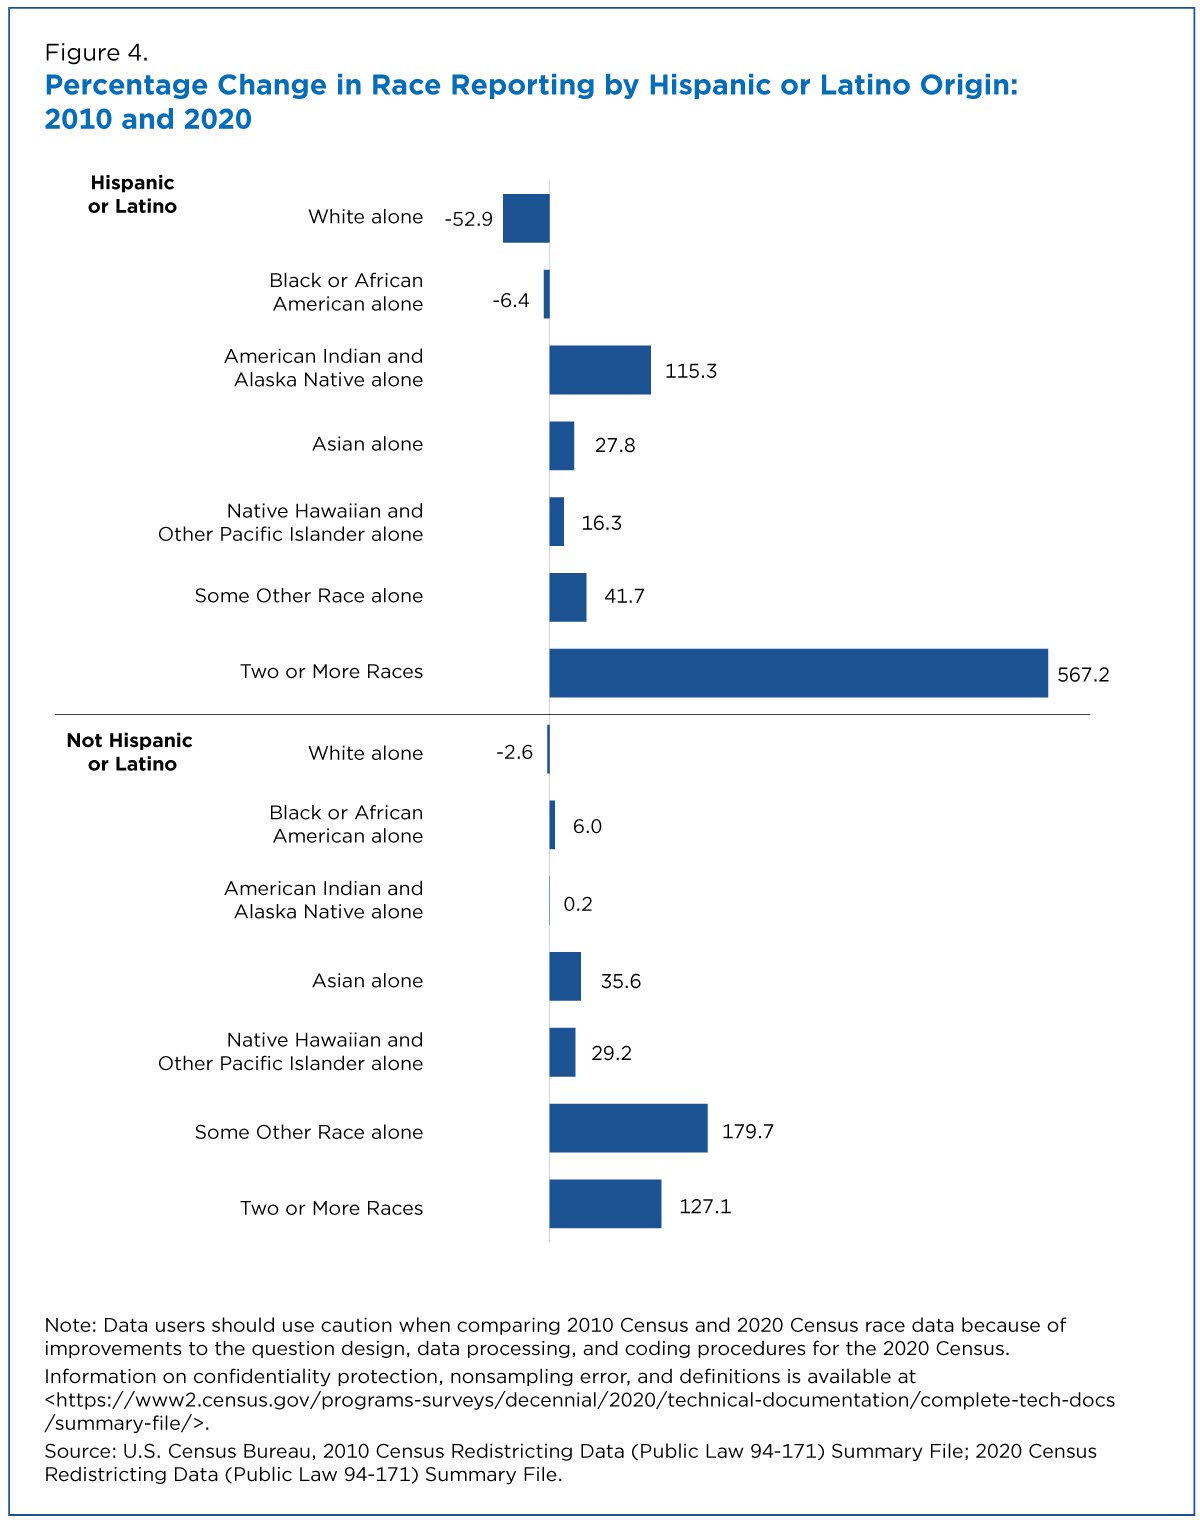
Between 2010 and 2020, the number of people of Hispanic or Latino origin reporting more than one race increased 567% from 3 million (6.0%) to 20.3 million (32.7%) (Figure 4).

We are confident these differences in racial distributions were largely due to the improvements to the design of the two separate questions for race and ethnicity, data processing, and coding, which enabled a more thorough and accurate depiction of how people prefer to self-identify.

  • In 2020, among people of Hispanic or Latino origin, 26.2 million people (42.2%) identified their race as Some Other Race alone, a 41.7% change from 2010.
  • The number of people of Hispanic or Latino origin who identified as White alone decreased by 52.9%, down from 26.7 million to 12.6 million over the decade.
  • The number of people who were not of Hispanic or Latino origin who identified as White alone declined at a slower rate, with a -2.6% change.


Race and Hispanic Origin by Age Group


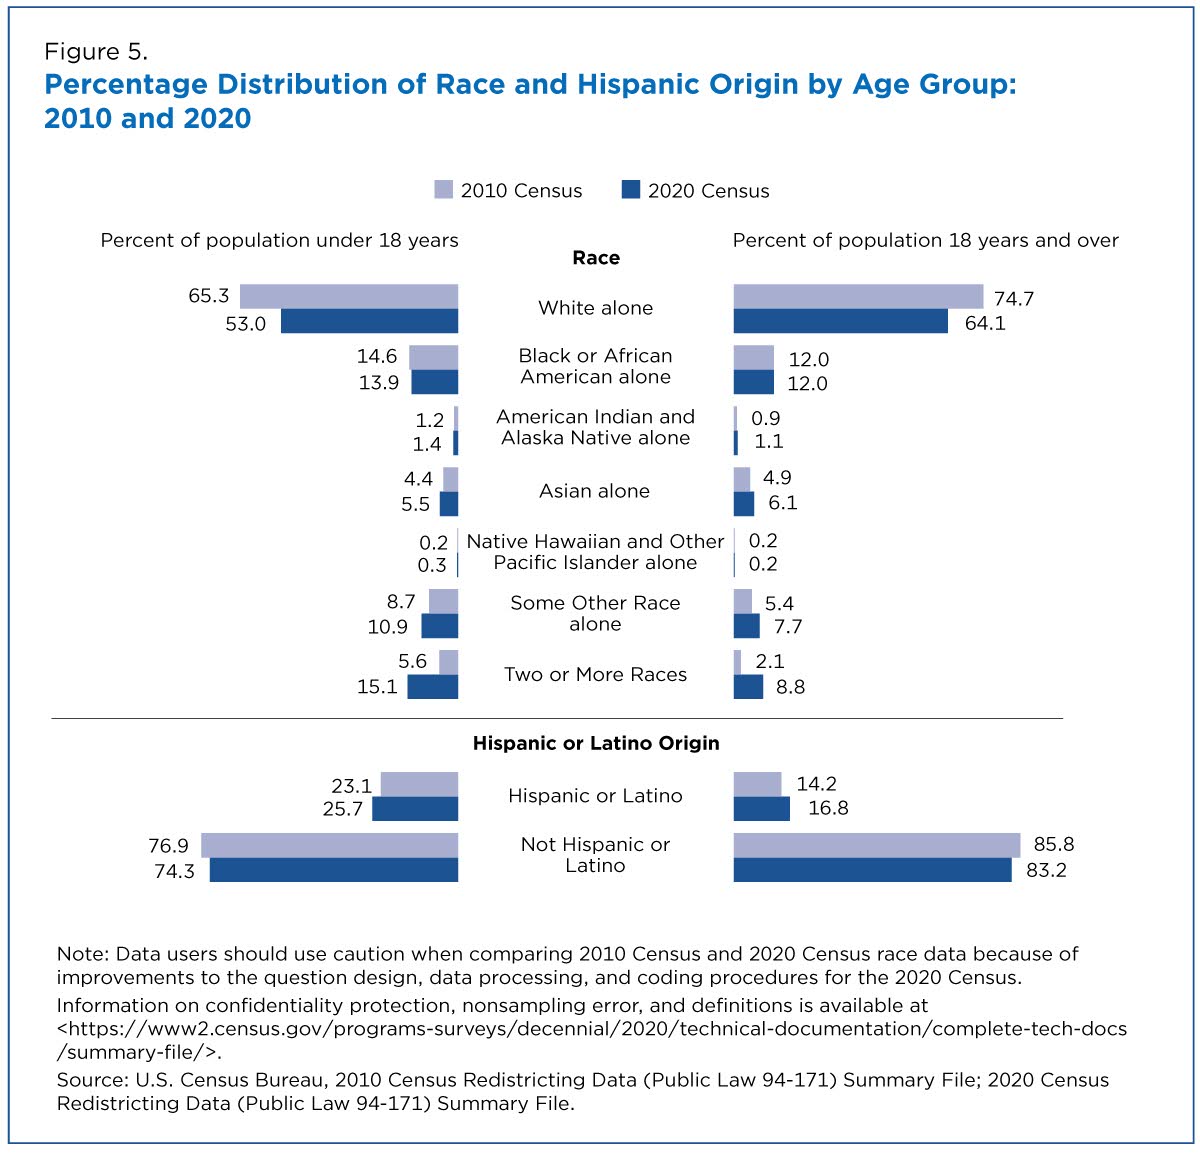
The 2020 Census data also enable us to examine the racial and ethnic composition of the population under age 18 (children) and the population age 18 and over (adults) (Figure 5).

The racial and ethnic composition among children is quite different from adults. This comparison offers insights into the demographics of younger generations in this country and glimpses of what the future may bring.

  • The White alone adult population (age 18 and over) went from 74.7% in 2010 to 64.1% in 2020. In contrast, the Multiracial adult population increased from 2.1% in 2010 to 8.8% in 2020.
  • In 2020, the Black or African American alone (12%), American Indian and Alaska Native alone (1.1%), and Native Hawaiian and Other Pacific Islander alone (0.2%) populations comprised similar shares of the total adult population as in 2010.
  • Among children, the White alone population changed from 65.3% to 53%; the Black or African American alone population changed from 14.6% to 13.9%.
  • The percentages increased for children in all other groups, especially the Some Other Race alone (8.7% in 2010; 10.9% in 2020) and Multiracial (5.6% in 2010; 15.1% in 2020) populations.
  • The percentages also increased for Hispanic or Latino children from 2010 to 2020 (23.1% to 25.7%).


Improved Race and Ethnicity Measures Reveal U.S. Population Is Much More Multiracial (census.gov)


Reply