Notifications
Clear all
Topic starter
HIV and Gay and Bisexual Men
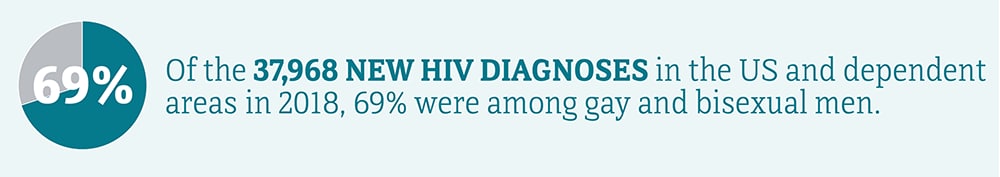
Gay, bisexual, and other men who reported male-to-male sexual contacta are the population most affected by HIV in the United States. In 2018, gay and bisexual menb made up 69% of the 37,968 new HIV diagnosesc in the United States (US) and dependent areas.d Approximately 492,000 sexually active gay and bisexual men are at high risk for HIV; however, we have more tools to prevent HIV than ever before.
The Numbers
HIV Diagnosesb
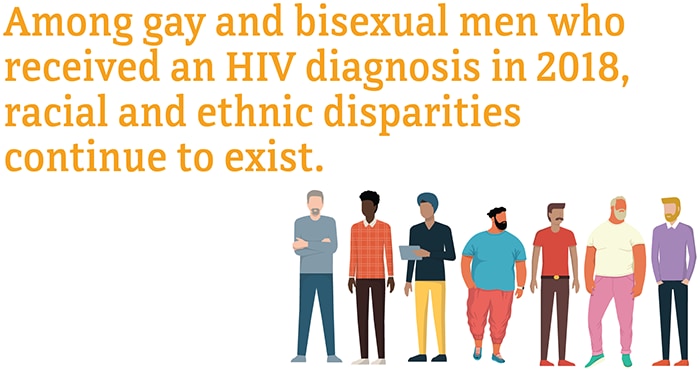
New HIV Diagnoses Among Gay and Bisexual Men in the US and Dependent Areas by Race/Ethnicity, 2018
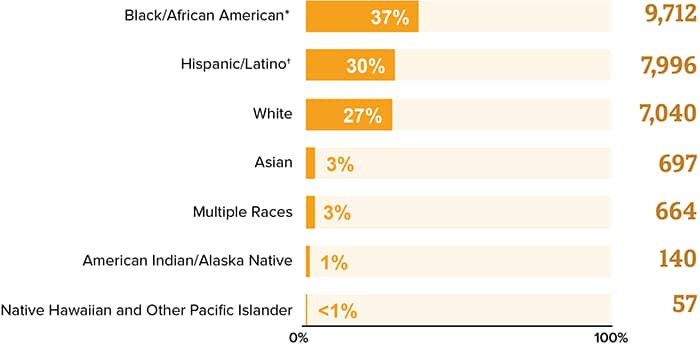
* Black refers to people having origins in any of the Black racial groups of Africa. African American is a term often used for Americans of African descent with ancestry in North America.
† Hispanics/Latinos can be of any race.
Source: CDC. Diagnoses of HIV infection in the United States and dependent areas, 2018 (updated). HIV Surveillance Report 2020;31.
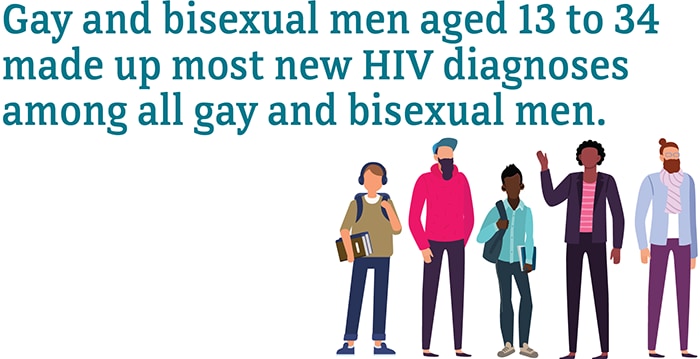
New HIV Diagnoses Among Gay and Bisexual Men in the US and Dependent Areas by Age, 2018

Total may not equal 100% due to rounding.
Source: CDC. Diagnoses of HIV infection in the United States and dependent areas, 2018 (updated). HIV Surveillance Report 2020;31.
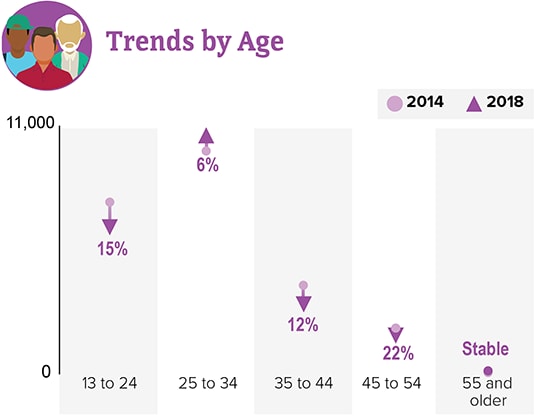
From 2014 to 2018, HIV diagnoses decreased 7% among gay and bisexual men overall. But trends varied for different groups of gay and bisexual men.
HIV Diagnoses Among Gay and Bisexual Men in the US and Dependent Areas, 2014-2018

* Black refers to people having origins in any of the Black racial groups of Africa. African American is a term often used for Americans of African descent with ancestry in North America.
† Hispanics/Latinos can be of any race.
‡ Changes in subpopulations with fewer HIV diagnoses can lead to a large percentage increase or decrease.
Source: CDC. Diagnoses of HIV infection in the United States and dependent areas, 2018 (updated). HIV Surveillance Report 2020;31.
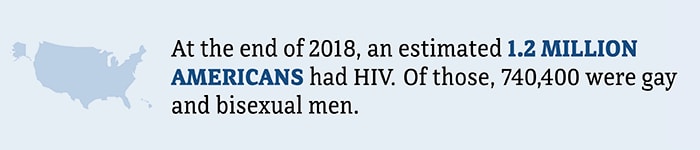
Living With HIV
Gay and Bisexual Men With HIV in 50 States and the District of Columbia
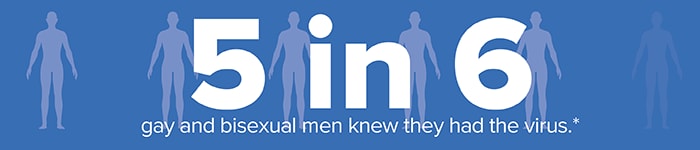
It is important for gay and bisexual men to know their HIV status so they can take medicine to treat HIV if they have the virus. Taking HIV medicine every day can make the viral load undetectable. People who get and keep an undetectable viral load (or stay virally suppressed) can live a long and healthy life. They also have effectively no risk of transmitting HIV to HIV-negative sex partners.
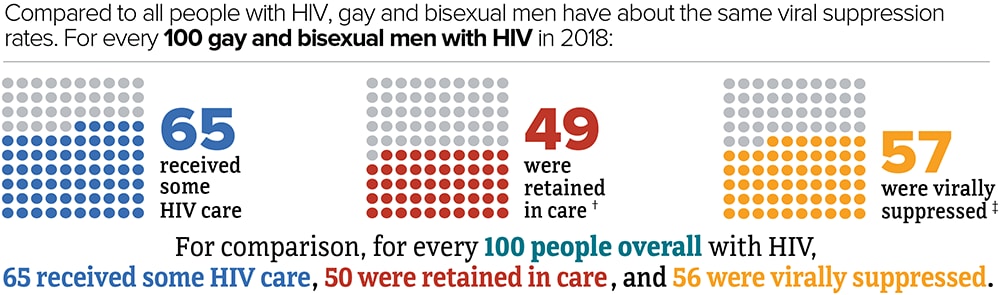
* Includes infections attributed to male-to-male sexual contact only. Among men with HIV attributed to male-to-male sexual contact and injection drug use, 12 in 13 knew they had HIV.
† Had 2 viral load or CD4 tests at least 3 months apart in a year.
‡ Based on most recent viral load test.
Source: CDC. Estimated HIV incidence and prevalence in the United States 2014–2018 pdf icon[PDF – 3 MB]. HIV Surveillance Supplemental Report 2020;25(1).
Source: CDC. Selected national HIV prevention and care outcomes pdf icon[PDF – 2 MB]. (slides).
Deathsb
In 2018, there were 8,049 deaths among gay and bisexual men with diagnosed HIV in the US and dependent areas. These deaths could be from any cause.
🤬#Fight Chinese Oppression #Viet Lives Matter 🤠 #Stop Chinese absorption of Vietnam. #Free Uyghurs #Free Austronesians in Taiwan. #free the Tibetans.
Posted : 15/06/2021 3:10 pm
keep it civil
Posted : 18/06/2021 10:50 pm